California’s Education Funding Crisis Explained in 12 Charts


Summary
California is the fifth largest economy in the world and the wealthiest state in the nation. The Golden State is home to countless tech giants, an enormous entertainment industry, major agricultural regions, and many other successful industries. California households earn a median income of $71,000 per year, more than $10,000 above the national average. However, California school funding—even before COVID-19—was insufficient to meet educational goals and address the needs of students, particularly given the state’s high cost of living. How can that be true? Why is education funding so low in California, despite its wealth and comparatively high tax revenues?
Through a series of 12 charts, we explain what is happening. For solutions, see the final section of this infographic and the in-depth report Securing and Protecting Education Funding in California.
THE PROBLEM: For decades, California has been underspending on education, especially given its high cost of living and the needs of its students.
California Has Been Spending Less Than the National Average on K–12 Education for Decades
After decades of underinvestment, California K–12 spending had nearly caught up to the national average before the current (2020) recession. In 2018, California spent $12,498 per pupil compared with $12,612 nationally, still well below other states like New York, Illinois, and New Jersey.
Inflation adjusted to 2018 dollars

Source. Summary Tables: Table 8. Per Pupil Amounts for Current Spending of Public Elementary–Secondary School Systems. In 2002 to 2018 Public Elementary–Secondary Education Finance Data by U.S. Census Bureau, n.d., (https://census.gov/data/tables/2018/econ/school-finances/secondary-education-finance.html).
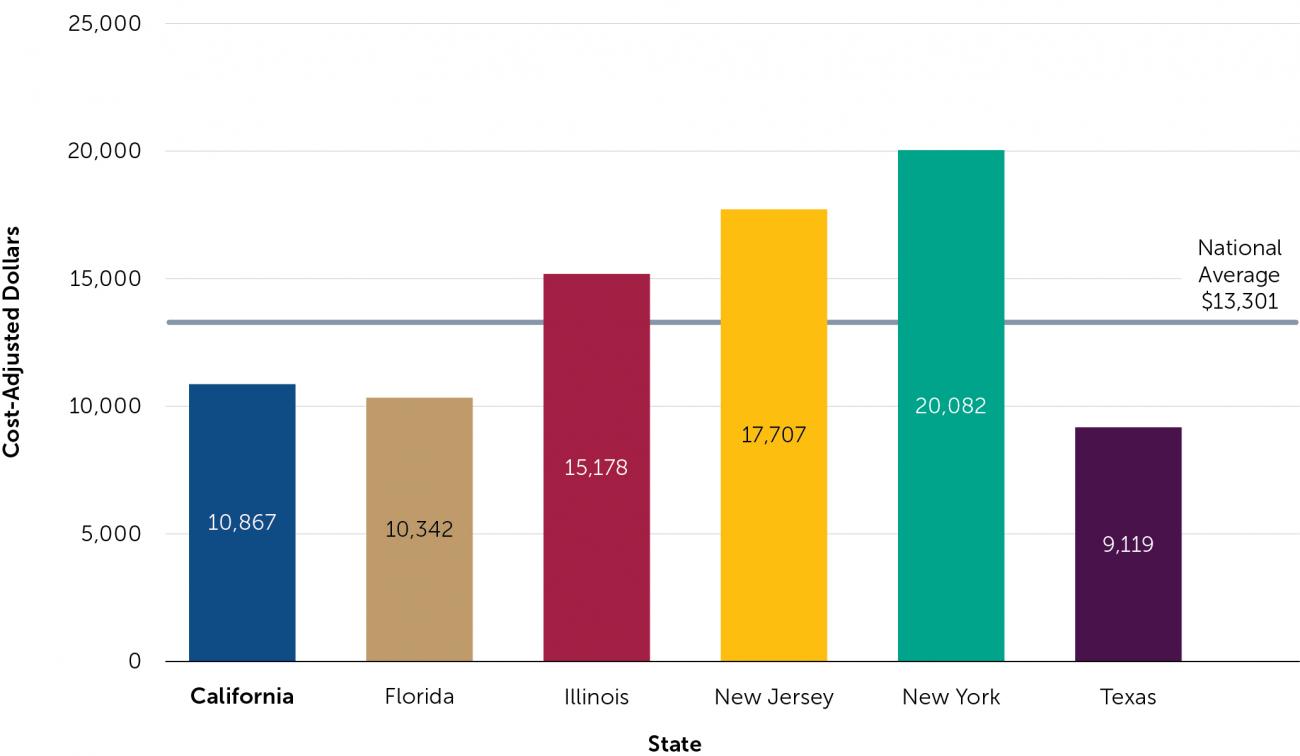
But When Adjusted for Differences in Cost of Labor, California Continues to Spend Far Less
Teachers and other school staff, like all workers in California, are paid more than those in other states. When adjusted for regional cost differences using the most recent Comparable Wage Index data, California spends well below the national average and less than many demographically similar states.
Adjusted for regional cost differences
Source. From Quality Counts 2020: State Grades on School Finance: 2020 Map and Rankings by Education Week Research Center, 2020, June 2 (https://secure.edweek.org/media/33qc-school-finance-table.pdf).
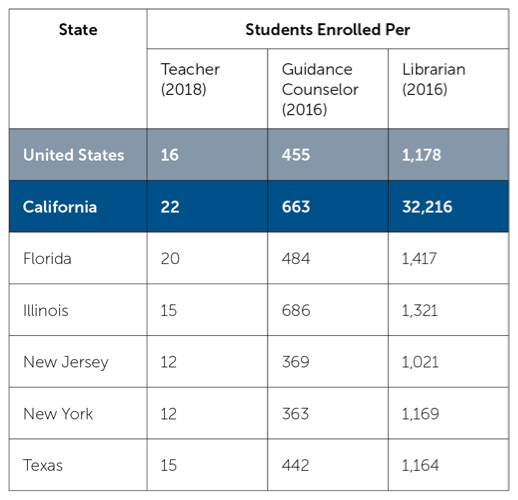
Because of California’s Higher Cost of Living, Schools and Districts in the State Can Afford Fewer Teachers, Staff, and Services Given Available Resources
This translates into larger class sizes and fewer pupil support personnel. In fact, California ranks at or near the bottom nationally when it comes to the number of students per teacher, guidance counselor, and librarian. Because salaries occupy a larger share of the budget, that also translates into fewer books and classroom supplies.
Sources. Information about teachers from Rankings of the States 2019 and Estimates of School Statistics 2020 [Report] by National Education Association Research, 2020, June (https://nea.org/sites/default/files/2020-07/2020%20Rankings%20and%20Estimates%20Report%20FINAL_0.pdf). Information about counselors and librarians from “Table 213.20: Staff Employed in Public Elementary and Secondary School Systems, by Type of Assignment and State or Jurisdiction: Fall 2016” by National Center for Education Statistics, n.d. (https://nces.ed.gov/programs/digest/d18/tables/dt18_213.20.asp).
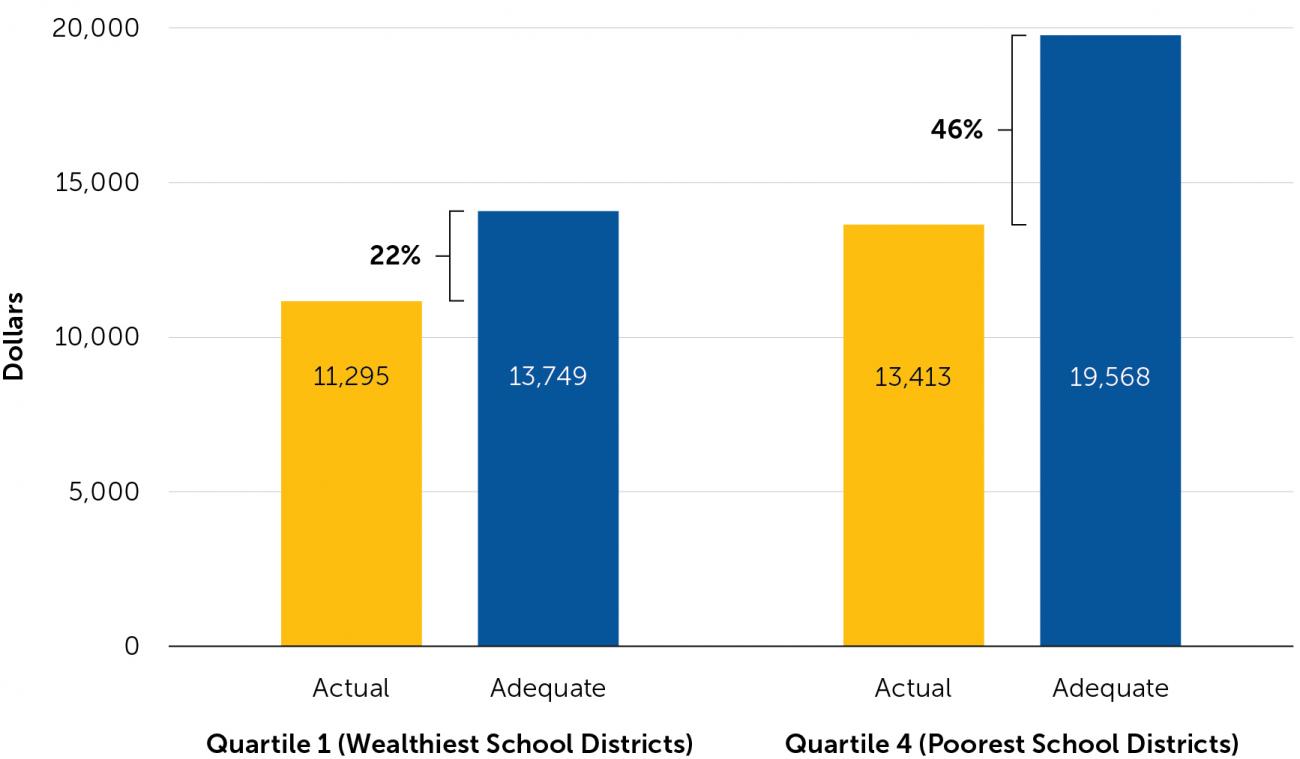
Although Meeting California’s Diverse Student Needs Costs More, California’s Highest Poverty Districts Are Furthest Away From Adequate Funding
California has the highest poverty rate in the nation when accounting for the cost of living, and income inequality has worsened in recent years. The COVID-19 pandemic is exacerbating the situation. Further, 38 percent of California’s K–12 students are or have been English learners. The state does spend more in districts serving higher percentages of low-income students and English learners, but not enough. Schools in the top quartile of student poverty would need to spend 46 percent more to meet these students’ needs. And because of long-standing neighborhood segregation and systemic racism, these high-poverty schools serve primarily Black and Latinx students, presenting a serious equity problem.
By free or reduced-prices lunch eligibility quartile
Source. From Getting Down to Facts II: Working Toward K–12 Funding Adequacy. California’s Current Policies and Funding Levels [Report], by J. Imazeki, P. Bruno, J. Levin, I. Brodziak de los Reyes, and D. Atchison, 2018, September, Policy Analysis for California Education (https://edpolicyinca.org/publications/working-toward-k-12-funding-adequacy-californias-current-policies-and-funding-levels).
THE REASON: California is spending less on education because of policy choices it has made. The state directs fewer resources to education than do other states, and its chosen tax sources are volatile, making education funding vulnerable during economic downturns.
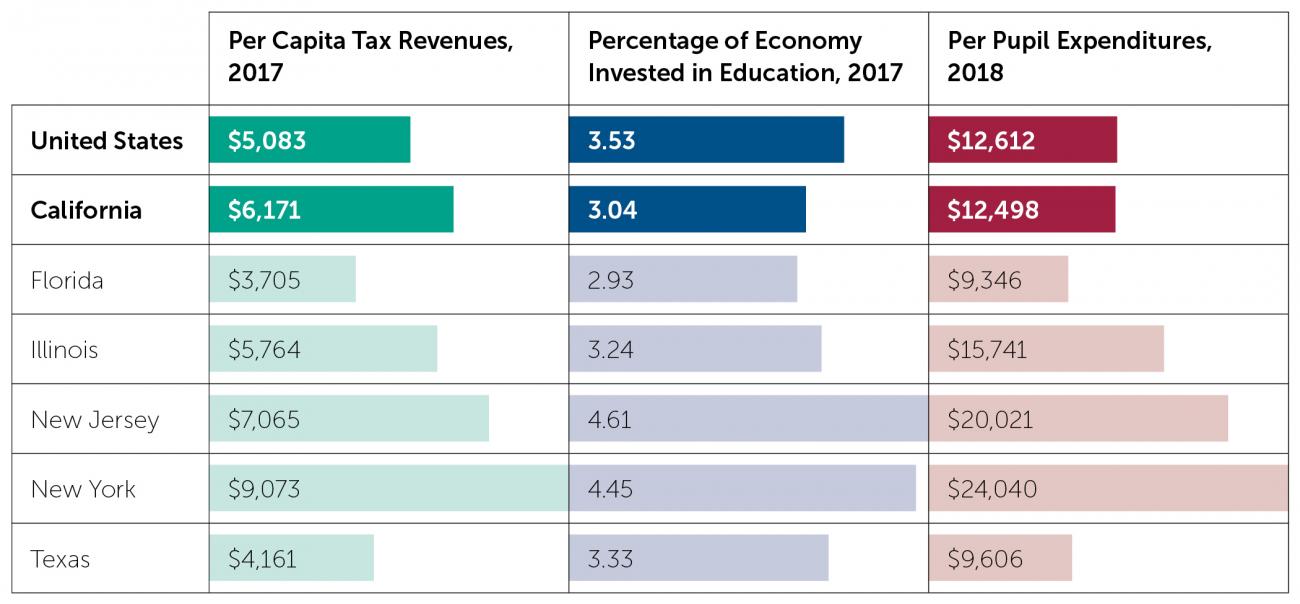
California Is a Relatively High-Tax State, but It Invests Less of Its Total Economy in Education Than Do Most Other States
California ranks 10th nationally in per capita tax revenue. However, it puts only 3 percent of its capacity (its Gross State Product) into education—less than comparable states. Also, education dollars must be spread across more students, since California has a comparatively high percentage of school-age children and children participating in the public school system. This drives down total per pupil spending.
Source. From State and Local Tax Revenue, Per Capita: 1977 to 2017, by Tax Policy Center, n.d. (https://taxpolicycenter.org/statistics/state-and-local-tax-revenue-capita); The Adequacy and Fairness of State School Finance Systems (2nd ed.), by B. D. Baker, M. Di Carlo, and M. Weber, 2020, February, Albert Shanker Institute, Rutgers Graduate School of Education, p. 9 (https://schoolfinancedata.org/wp-content/uploads/2020/02/SFID_AnnualReport_2020.pdf); Summary Tables: Table 8. Per Pupil Amounts for Current Spending of Public Elementary–Secondary School Systems. In 2002 to 2018 Public Elementary–Secondary Education Finance Data by U.S. Census Bureau, n.d., (https://census.gov/data/tables/2018/econ/school-finances/secondary-education-finance.html).
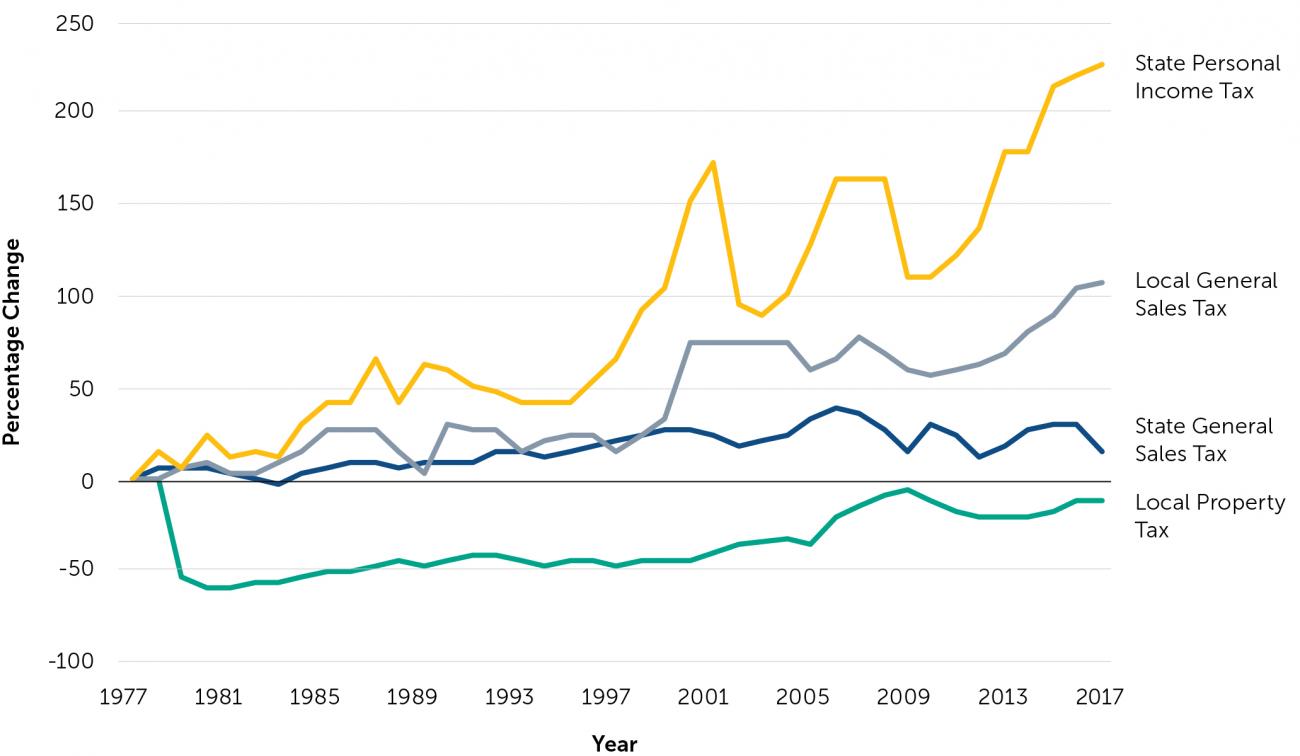
California Spent More on Education Before 1978’s Proposition 13 Severely Limited the Growth of Property Taxes
Voter-approved Prop 13 limited the local property tax rate to 1 percent and capped the annual increase in the assessed value at no more than 2 percent each year, or the rate of inflation, whichever is lower. The proposition led to an immediate and significant decline in state and local revenues. Since 1977, property tax revenues have declined 12 percent. To compensate, state income tax revenues have increased by 226 percent, and sales tax revenues have increased by 107 percent.
Real per capita revenue, indexed to 2017 dollars
Source. From California’s State and Local Revenue System, by R. C. Auxier, T. Gordon, and K. Rueben, 2020, July, Urban Institute, p. 7 (https://taxpolicycenter.org/sites/default/files/publication/159764/californias-state-and-local-revenue-system.pdf).
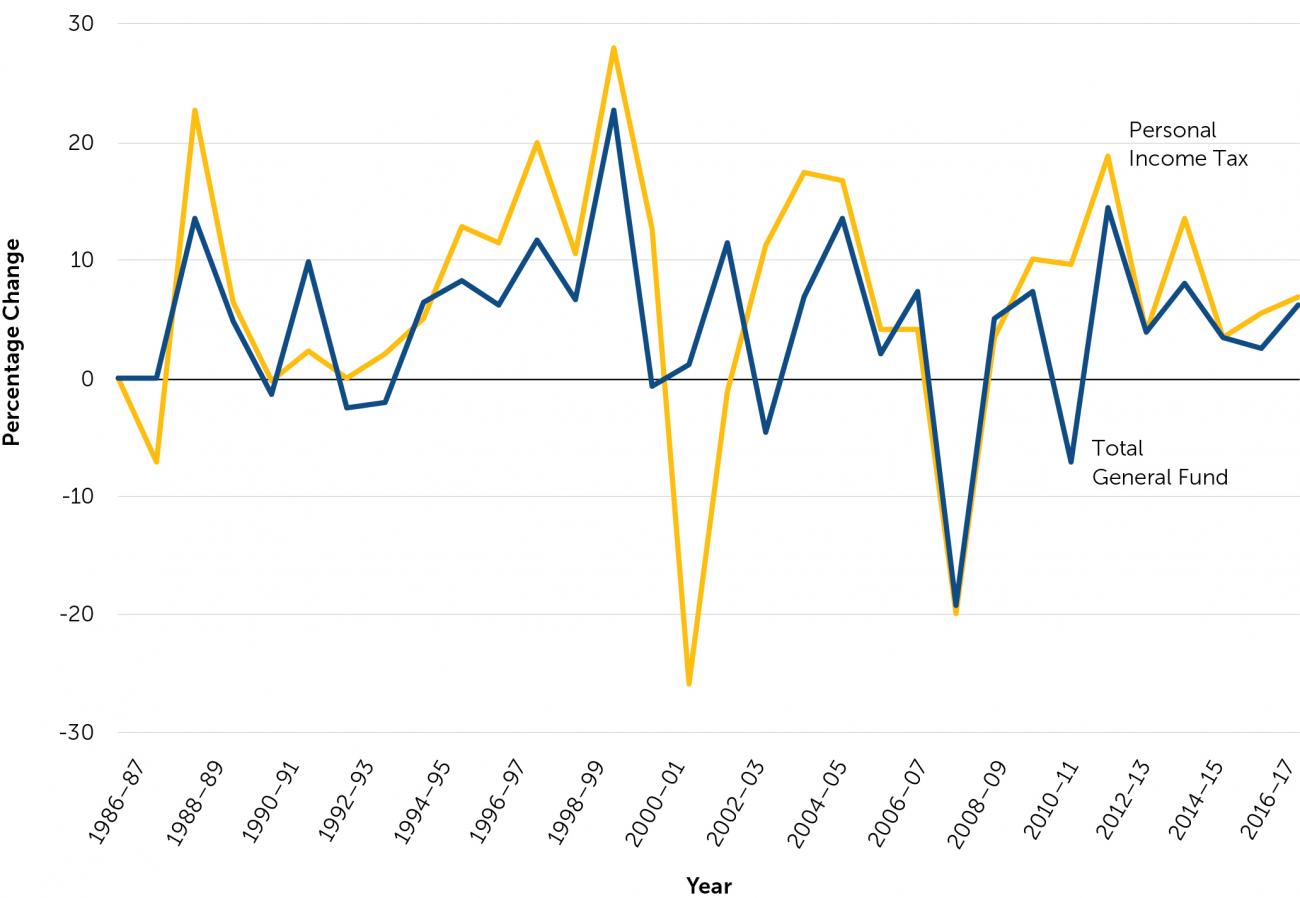
California’s Revenues Now Rely Heavily on the Income Tax, Which Is More Volatile Than the Property Tax
California’s top 1 percent of income earners pay more than 40 percent of personal income taxes. These high income earners’ taxes are largely based on capital gains as well as partnership income, dividends, interest, and rent. When the economy is in turmoil, the tax base in California declines more than it does in other states.
Source. From Historical Data, by Legislative Analyst’s Office, n.d. (https://lao.ca.gov/PolicyAreas/state-budget/historical-data).
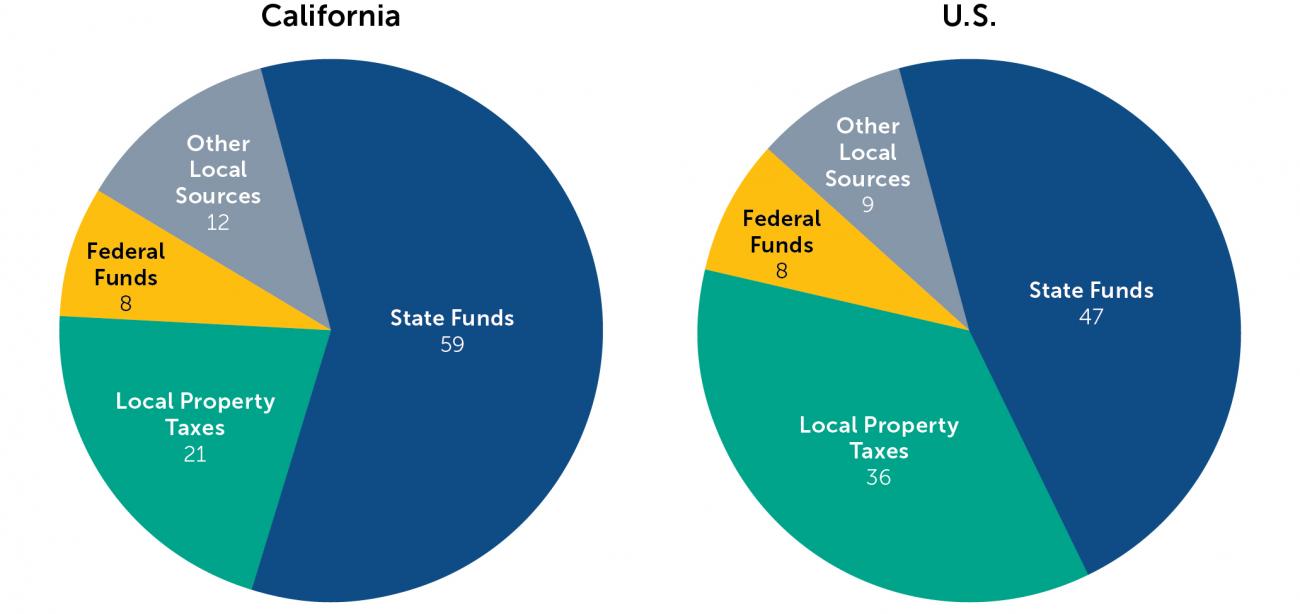
With Less Property Tax Revenues, California’s Schools Are More Dependent on State Funds Than Schools Are in Most Other States
Because education funding is heavily reliant on the state’s General Fund and therefore on volatile income taxes, state education funds are highly vulnerable to economic fluctuations. School funding surges in good economic years and plummets during economic contractions.
Source. From Securing and Protecting Education Funding in California [Report], by C. Hahnel, H. J. Hough, and J. Willis, 2020, September, Policy Analysis for California Education (https://edpolicyinca.org/publications/securing-and-protecting-education-funding-california).
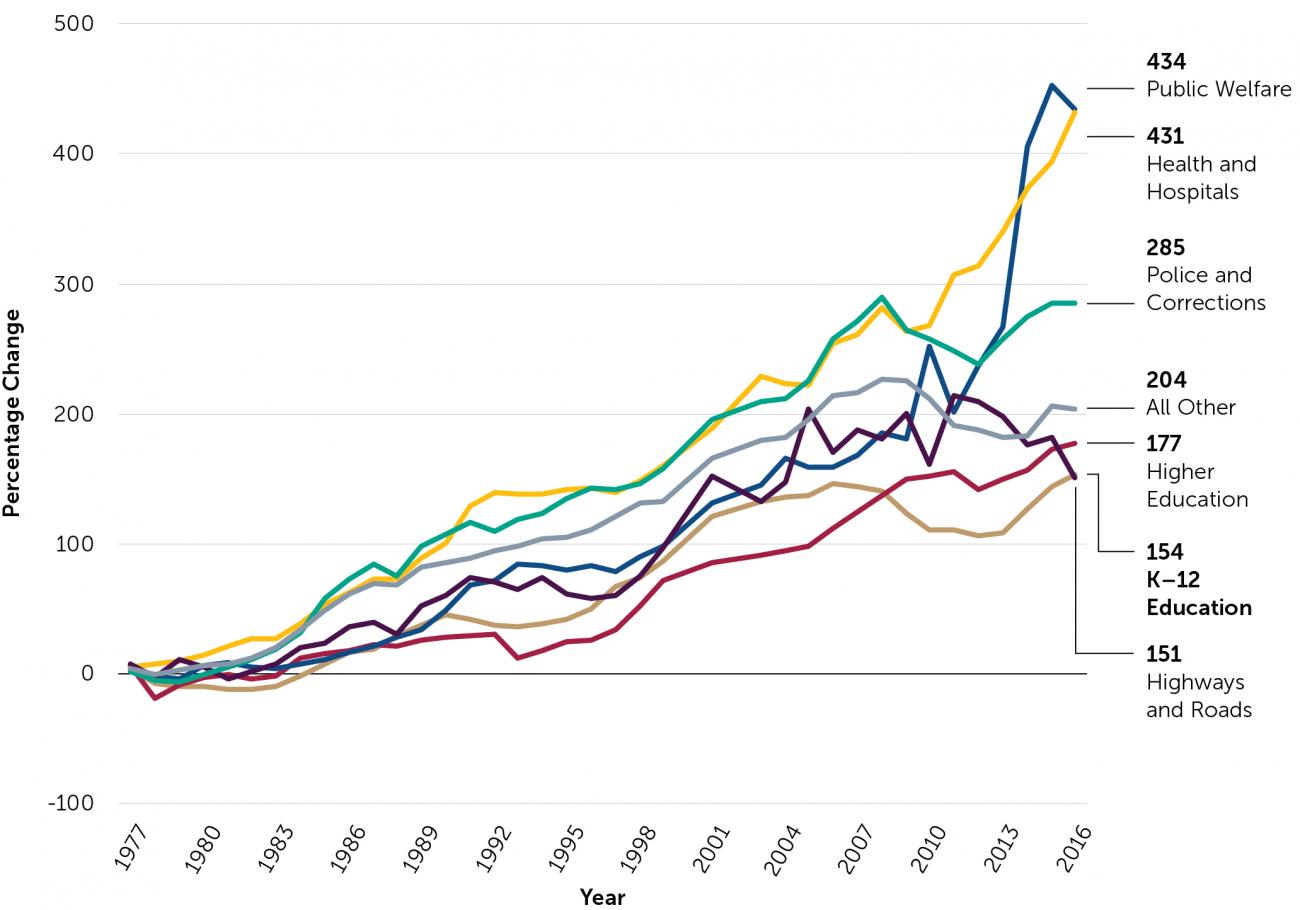
State Spending on Education Has Grown at a Slower Rate Than Spending on Other Program Areas
Over the past four decades, California K–12 education spending has increased by 1.5 times and higher education spending has increased by 1.7 times. In comparison, spending on police and corrections has nearly tripled and spending on health and hospitals and public welfare has more than quadrupled. As a result, the percentage of overall state and local spending on K–12 education has decreased from 25 to 18 percent, and the percentage of spending on higher education has decreased from 11 to 9 percent.
Real expenditures, indexed to 2017 dollars
Source. From State and Local Finance Data: Exploring the Census of Governments, by Urban Institute, n.d. (https://state-local-finance-data.taxpolicycenter.org).
Note. Excludes spending on government-run liquor stores, utilities, and insurance trusts. Medicaid spending is divided between the public welfare and health and hospitals functional categories, with the majority allocated to the former. 2001 and 2003 local government aggregates are not available; missing values are connected by a line of best fit.
MAKING MATTERS WORSE: A dollar doesn’t stretch as far as it once did. Costs are increasing and demographic changes are causing fiscal challenges for districts.
School District Costs Are Increasing Faster Than Revenues, Further Drawing Dollars Away From the Classroom
Districts are spending more on health care for current employees and retirees, and they are making larger contributions to employee pension funds to pay down massive unfunded liabilities. While these additional costs do not necessarily translate into better health care or larger retirement benefits, they do make public education more expensive.
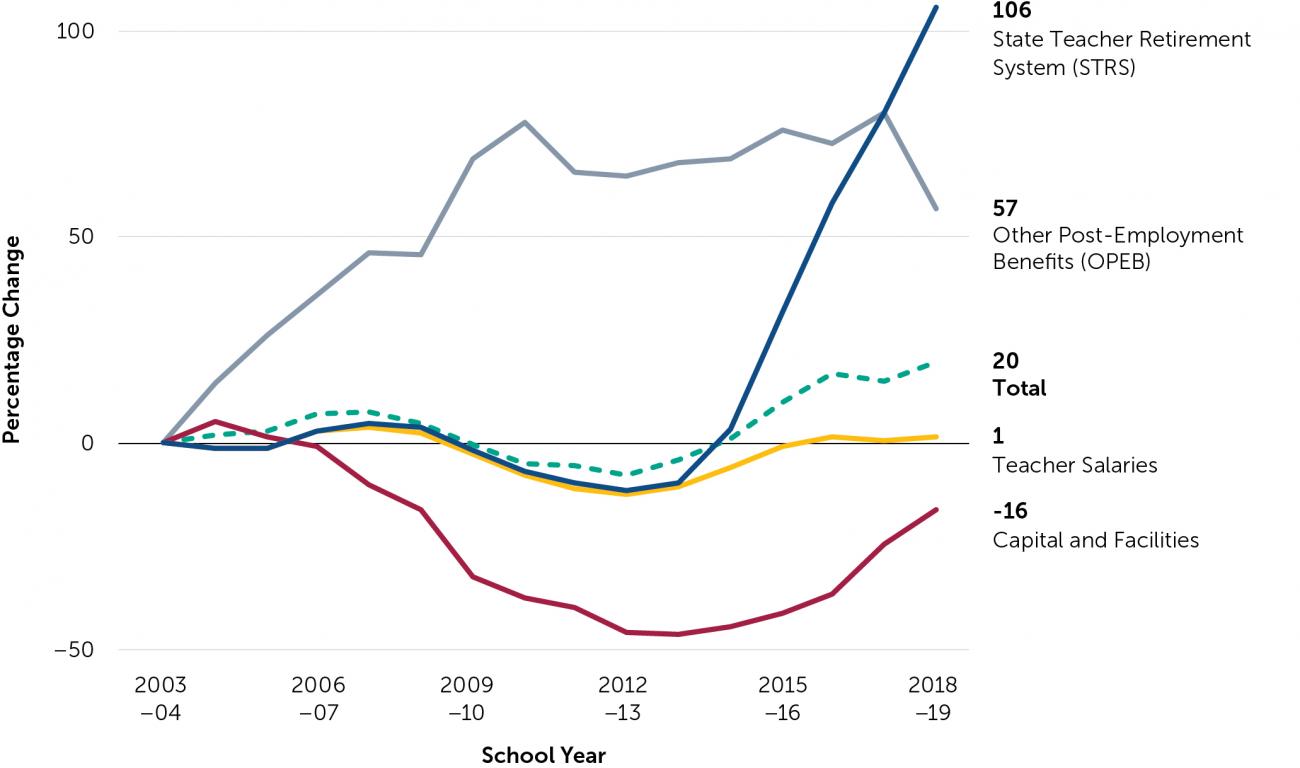
Source. Figure is based on and updated from analysis in The Challenges of Employee and Retiree Health Benefit Costs for California Districts [Report], by P. Bruno, 2019, May, Policy Analysis for California Education (https://edpolicyinca.org/publications/challenges-employee-and-retiree-health-benefit-costs-california-districts).
Note. Inflation adjusted. Excludes county offices of education and joint-powers authorities.
Many School Districts Are Experiencing Declining Enrollment
California’s birth rate has fallen, its population growth is slowing, and migration—in part due to high housing costs—is drawing Californians from coastal to inland areas. As a result, many school districts are experiencing declining enrollment. During the COVID-19 pandemic, many parents say they are considering leaving the public education system altogether or moving out of state. Districts lose per pupil revenues as enrollment drops, but they are often unable to reduce staffing, facilities, and debt payment costs at the same rate.
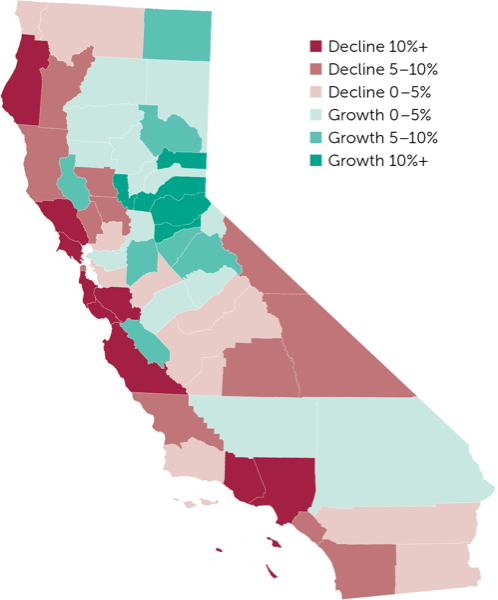
Source. From Changes in K–12 Enrollment across California’s Counties, by R. Mehlotra, J. Lafortune, and P. Warren, 2020, February, Public Policy Institute of California (https://www.ppic.org/interactive/changes-in-k-12-enrollment-across-californias-counties/).
Without Intervention, the Pandemic-Induced Recession Is Likely to Put Districts in Financial Distress for the Next Decade
During and in the wake of the Great Recession (2007–08 to 2012–13), the number of school districts in fiscal distress surged. Many posted “qualified” budgets, signaling an inability to meet financial obligations for the current and next 2 fiscal years, and a small number posted “negative” budgets, indicating an inability to meet obligations in the current or next fiscal year. California economic forecasts are still uncertain, but a recovery is likely to take at least a few years. This slowdown could push many districts back into fiscal distress. In 2020–21, the state deferred a significant amount of funding to school districts in the hopes that federal stimulus funding would come through—something that has not materialized as of October 2020.
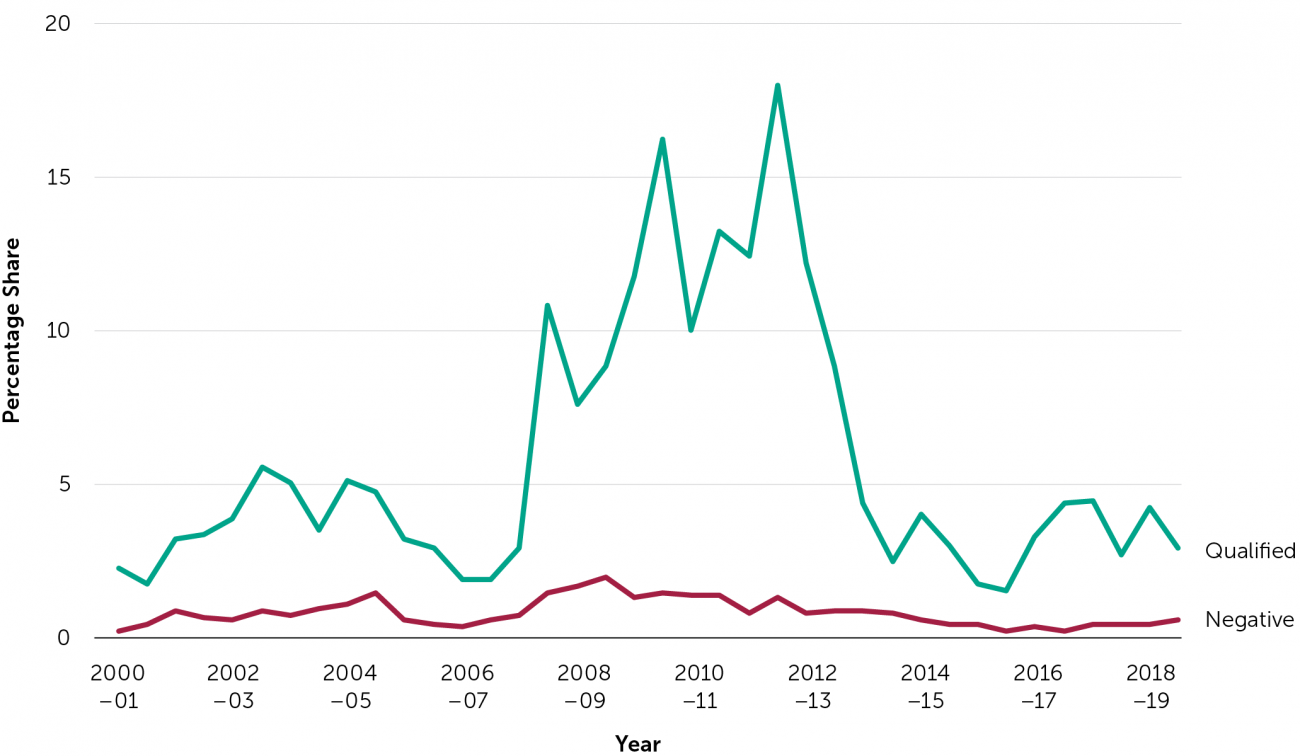
Source. From personal communication with Legislative Analyst’s Office, 2020, October 5.
THE SOLUTIONS: California’s leaders and education stakeholders must invest in California’s future.
To get there, all the following are needed:
- additional federal dollars;
- additional and more stable state and local tax revenues, including from the property tax;
- reductions in state tax expenditures (eliminate credits and close loopholes);
- a master plan for education funding;
- better fiscal transparency; and
- modernized school funding infrastructure.
Read more about these solutions in Securing and Protecting Education Funding in California.
Endnotes can be found in the full infographic—which was updated on October 21, 2020 to clarify the text above Figure 5—here.